Insight Lane
Open source platform for analyzing risk on road networks
Open source platform for analyzing risk on road networks
In making improvements to the safety of the road network, cities want to be able to make the largest impact for each dollar they spend. This means identifying the roadways that pose the most risk to residents, be they in a car, on a bike or on foot. This is the need the Insight Lane platform is trying to address; providing intelligence about the road network with limited data and technical resources.
The way the current Insight Lane platform does this is by taking in and processing a set of roadway features and crash incidents, fitting a machine learning model to these features and outputting a “risk score” for each road segment. If the city has access to information on whether the crash involved vehicles, bikes or pedestrians, this risk score can be adapted to the risk to each mode. Visualizing this on the road network provides a general idea of “high risk” zones in the city.
However, it’s difficult to translate this into an actual intervention. Typically, interventions involve looking at a particular “route”; a set of segments together. It’s more useful to get a route-level estimation of risk rather than individual segments. For example, take a look at Boston’s high crash network. Based on analysis of crash density, Boston determined that these routes were part of a dangerous route network in need of intervention. Targets for Boston’s “Slow Streets” interventions overlay neatly on sections of this high crash network.
After some conversations with Boston, we realized this “high crash network” was an important development for the city. We thought it might be important to make a similar functionality available in the Insight Lane platform. So, building on the output of the model, we developed a method for determining high-risk routes. Currently much of this work is experimental, but we’ve made the code available here: ().
Building a “high crash network”
Since the risk scores are attached to individual segments of the road, we’re able to use them as attributes in routing algorithms available on Python libraries like NetworkX and OSMNX. We first obtained every mile-long route in a specific section of Boston. For each segment along each route, we attached the risk score. We then could take the 5 routes with the highest risk score (normalized by distance) for each mode and map them:
Compare this to Boston’s analysis:
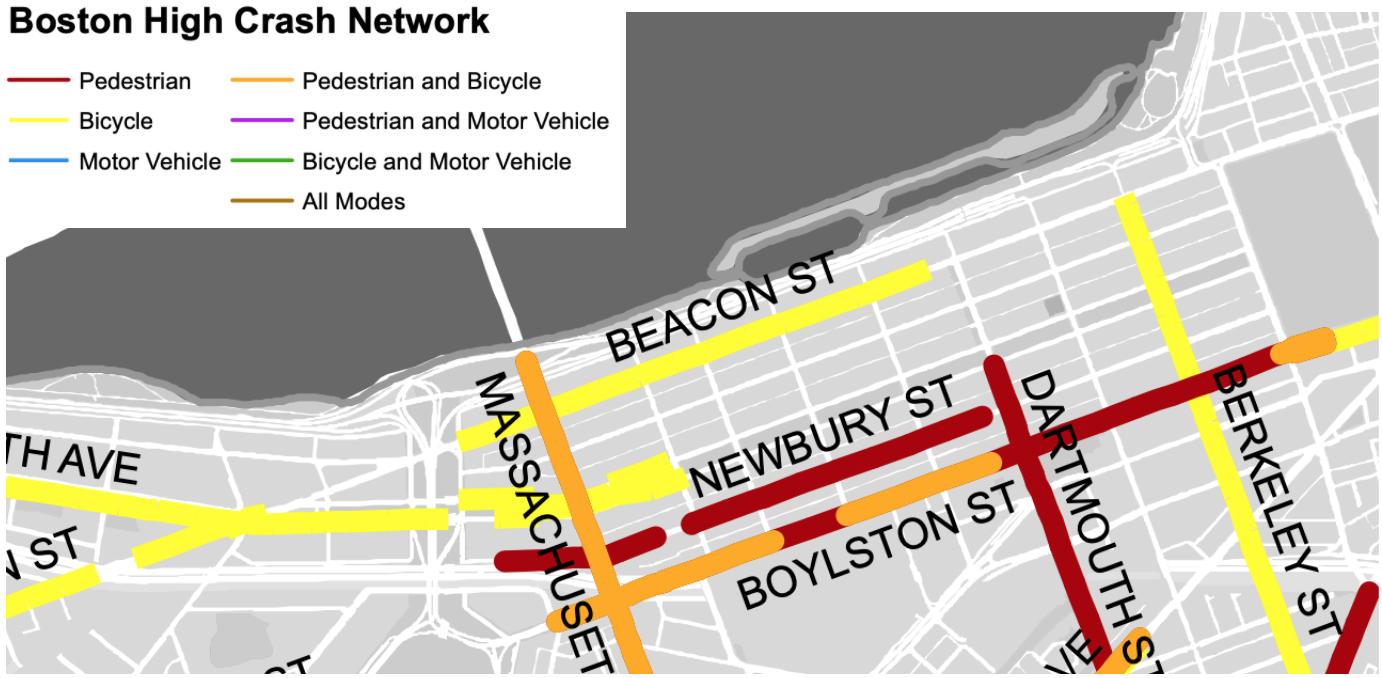
(source)
You can see they’re pretty different. That’s because Boston uses crash density as its measure. The Insight Lane model is a bit more involved; it incorporates a number of aspects of the network (e.g. speed limit, volume) in order to estimate “risk”. Not that one is better than the other, but they measure different things.
Related to this is why the routes from Insight Lane appear a bit more “noisy”. This is partially because Boston’s final map is the product of a lot of work from different groups, but also because our processing pipeline does its best to snap crash locations to the road network. Spot checks show it does reasonably well, but there’s definitely some noise in the process (e.g. some of the high risk pedestrian routes go along the highway).
Safe routes to school
Another initiative that Boston embarked on is Safe Routes to School. The goal here was to create a safer way for students and families to travel by foot or by bike in the Roxbury neighborhood. We were interested in analyzing the risk of routes to school for pedestrians in the neighborhood and the relationship between this risk network and the roads targeted for intervention.
As an example, we chose the Ellis Elementary School in Roxbury and identified all routes that were under a mile from the school. Then, we identified where the highest risk and lowest risk routes were and mapped them:
Looking at this alongside the Safe Routes initiative map:
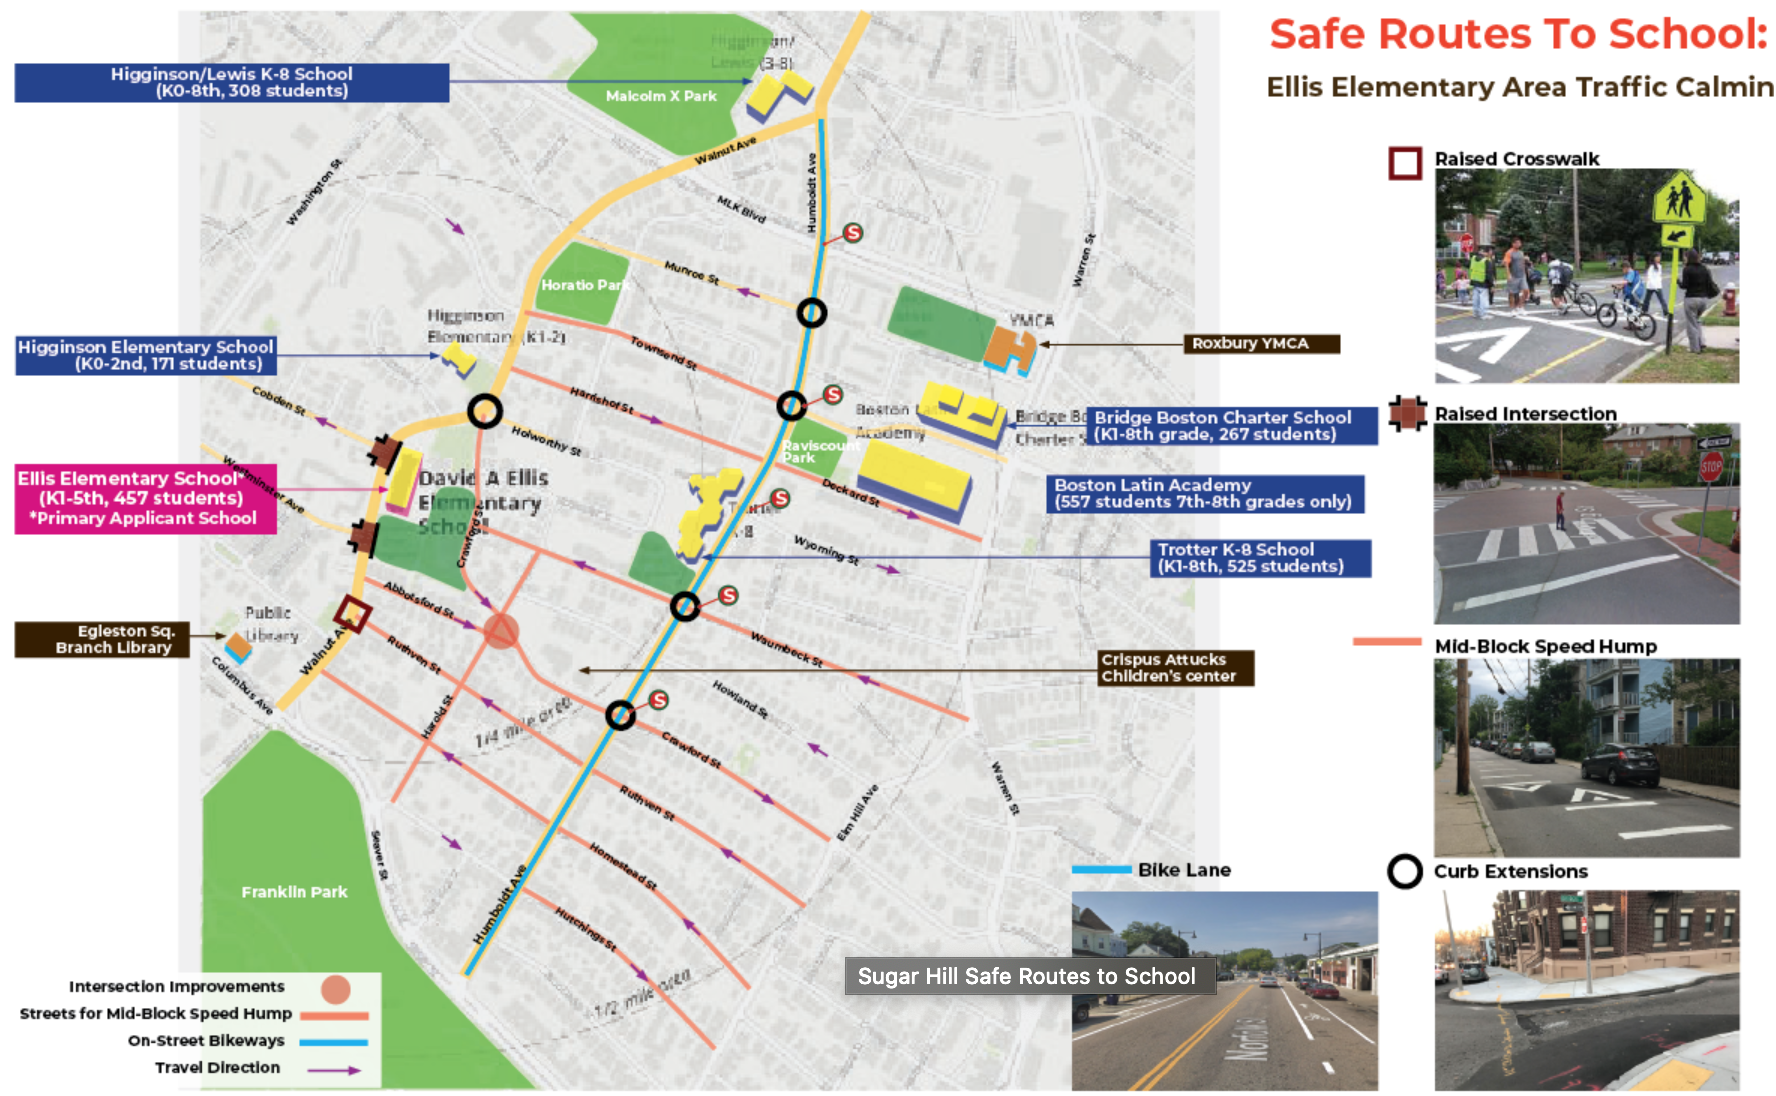
(source)
We can see Boston’s plan definitely seems to be covering a lot of the last leg of routes to the Ellis school. But we can also see that a lot of that area seems to be reasonably low risk as-is, based on our model. “High risk” routes seem to reach that “high” status from roads that are outside of the safe routes network. That may suggest that while the area close to the school will be safer, individuals coming from outside of that area may still be exposed to high risk routes.
Of course, a lot more analysis would be needed to draw a conclusion like this. But this demonstrates the ability of a platform like Insight Lane to be used to assess the risk of different routes in the road network and potentially prioritize interventions.
There’s more to come on this. If you’re interested in taking a look at the code for this analysis, check out this notebook.
As always, reach out to us at info@insightlane.org. And if you’re interested in having a similar set of analysis performed for your city, fill out this form. We’re an all-volunteer all-open-source group. Join us on slack.